
To date, coronavirus testing in the US has been extremely limited. Confirmed COVID-19 case counts underestimate the total number of infections in the population. We estimated the total COVID-19 infections – both symptomatic and asymptomatic – in the US up to April 18, 2020. We used a semi-Bayesian approach to correct for bias due to incomplete testing and imperfect diagnostic accuracy. We estimated that the number of COVID-19 infections in the U.S. was 3 to 20 times higher than the number of confirmed cases, with substantial variability by state.
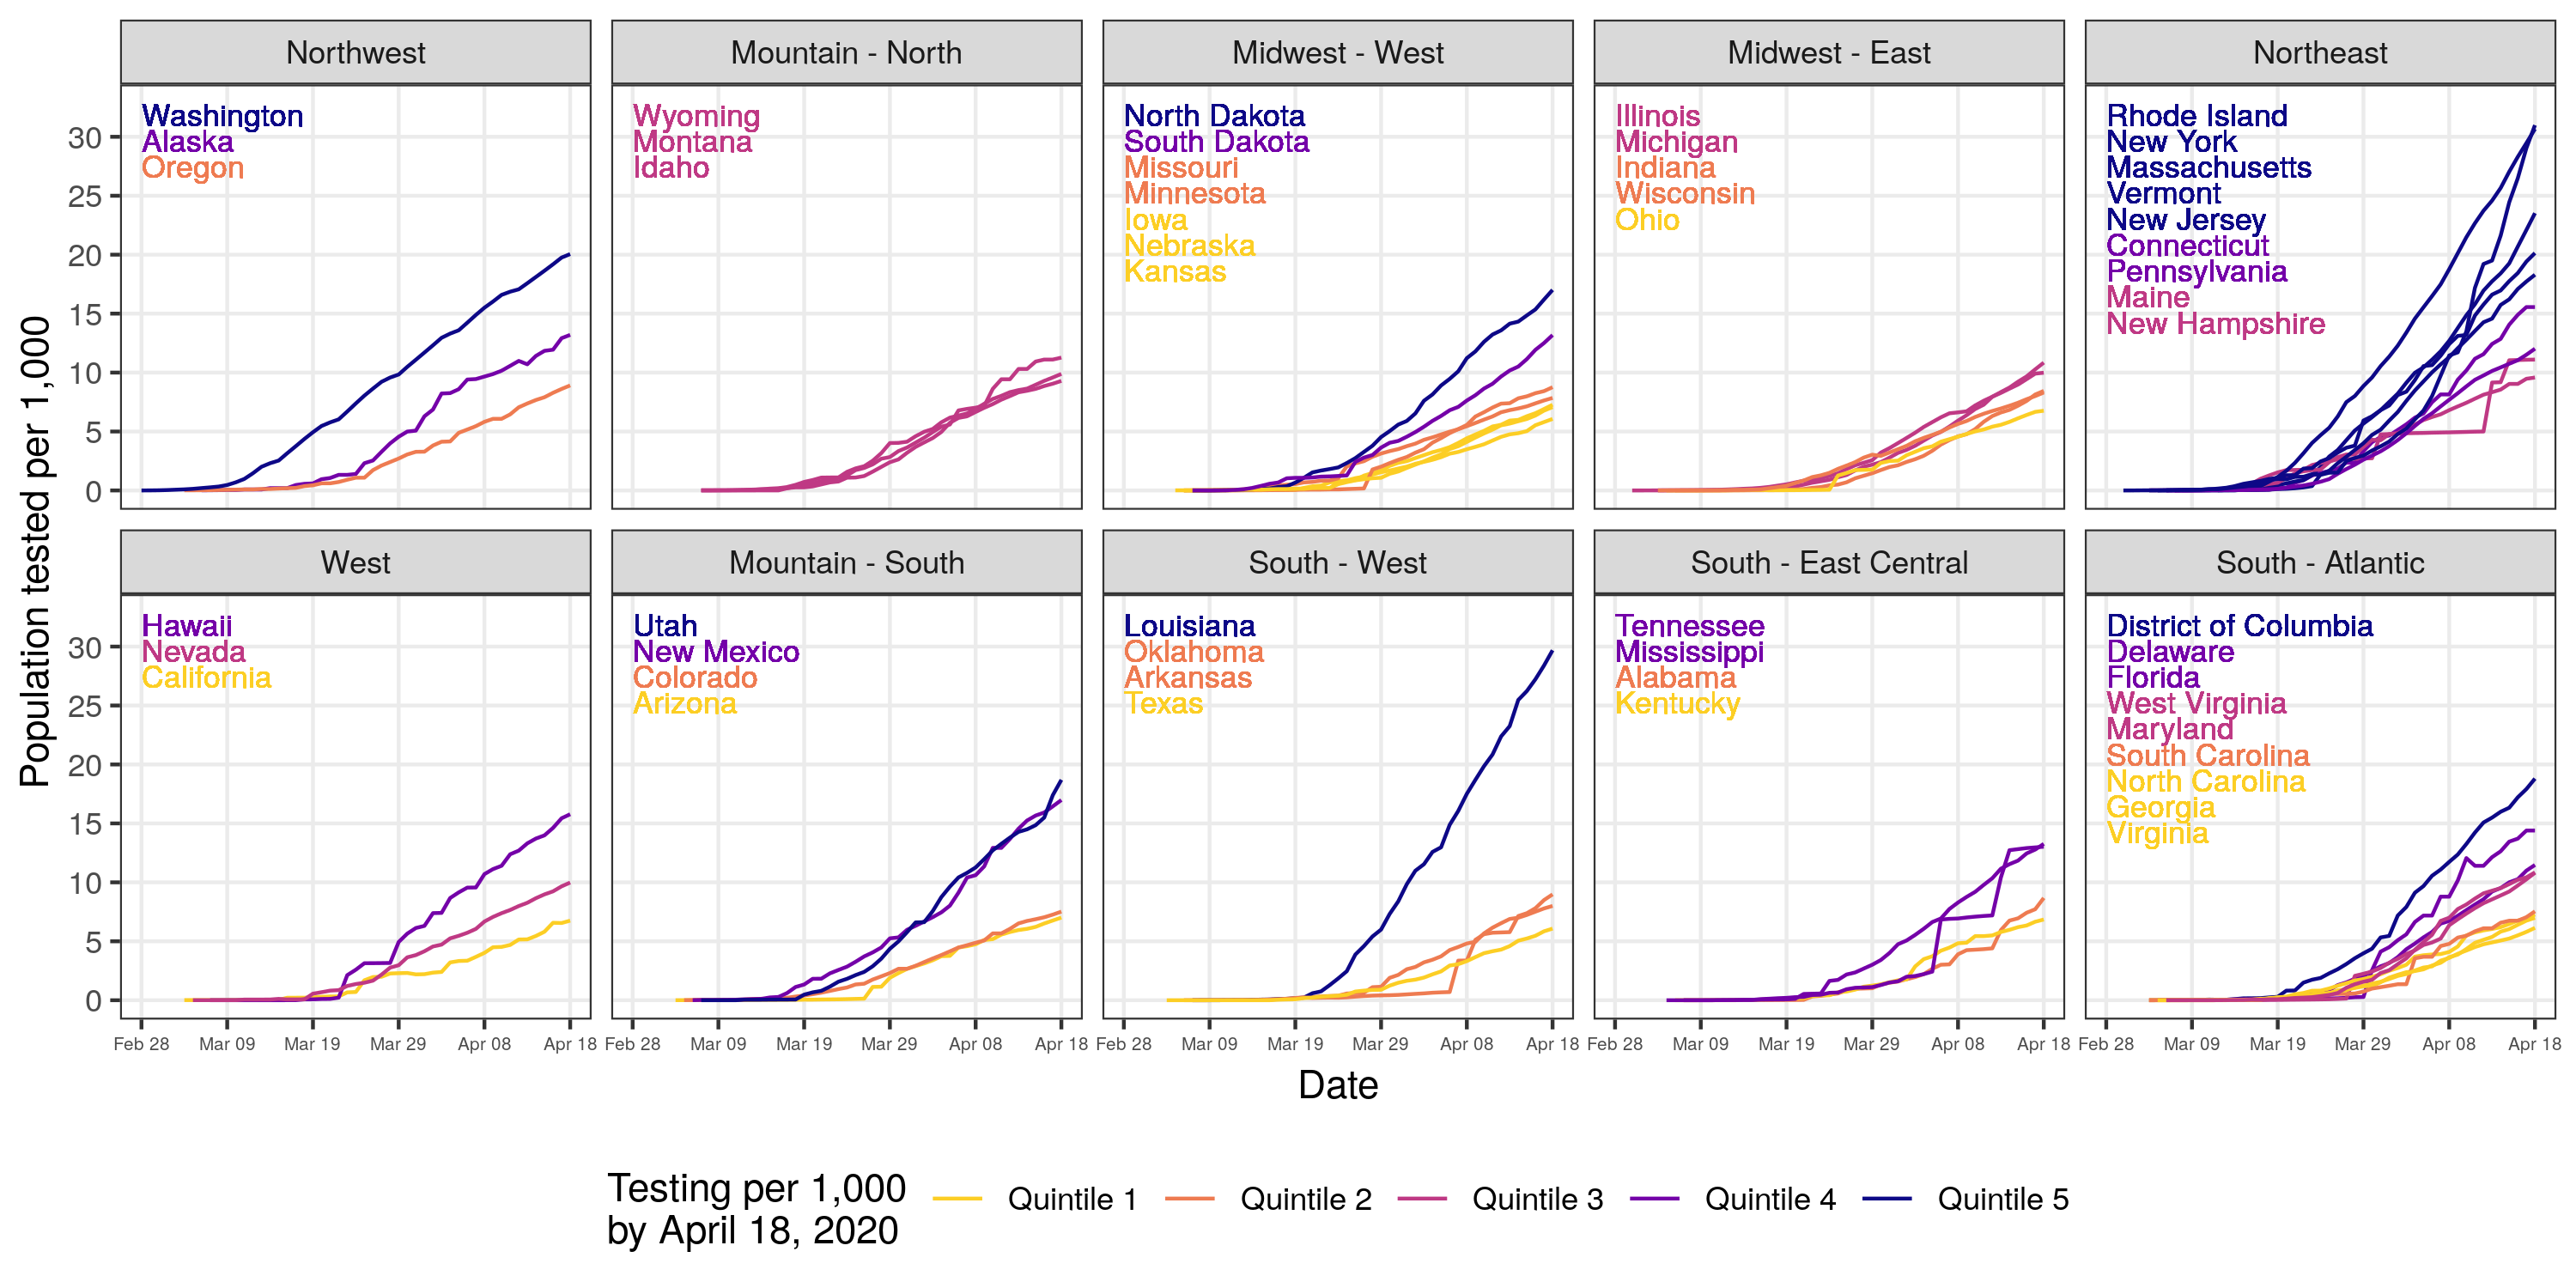
COVID-19 testing rates vary widely between states
In March and April, 2020 COVID-19 testing increased from 0.9 to 11 per 1,000 in the U.S. However, there were large discrepancies in testing between states, with state-level testing rates of 6 per 1,000 in Kansas to 31 per 1,000 in Rhode Island.
Current confirmed COVID-19 case counts vastly underestimate total infection burden.
Correcting for incomplete testing and imperfect diagnostic accuracy, we estimated that the total number of COVID-19 infections was 6,454,951 (19 per 1,000) by April 18, 2020. This number vastly exceeds the 721,245 confirmed cases (2 per 1,000) COVID-19 cases reported during that period.
Below, estimated total COVID-19 infections – including symptomatic and asymptomatic infections – are shown. Accounting for uncertainty in our model, the number of estimated infections in the U.S. was 3 to 20 times higher than the number of confirmed cases.
Disparities between confirmed case counts and estimated infections varied by state.
The ratio of estimated infections to confirmed COVID-19 cases can be interpreted as the multiplication factor for a given state. For example, in Kansas, the number of estimated infections is 19 times the number of confirmed COVID-19 cases. The states with the highest discrepancy – shown at the top of the graph – between estimated infections and confirmed case counts tended to have lower testing rates per capita.
Geographic disparities in testing contribute to larger underestimates in certain regions.
Underestimation of SARS-CoV-2 infections was more common in Puerto Rico, California, the Midwest, and certain states in the south southern states.
Methods
We used a probabilistic bias analysis to correct confirmed COVID-19 case counts for under testing, systematic testing of individuals with moderate-to-severe infection, and imperfect diagnostic accuracy. We used the best available evidence to define prior distributions of the probability of being symptomatic if tested for COVID-19, being symptomatic if not tested, and testing positive among symptomatic and asymptomatic individuals. Using Bayesian melding, we constrained these probabilities by an assumed distribution of the probability that individuals who tested positive were asymptomatic using evidence from populations with more widespread testing. We also corrected for the possilibity of false negative test results (imperfect test sensitivity). Prior distributions build in uncertainty given the limited information about COVID-19 testing among symptomatic and asymptomatic individuals to date. Analyses include cumulative confirmed COVID-19 case counts up to April 18, 2020. Disaggregated state-level data prior to February 28, 2020 was not readily available. We will update this site with estimates for April 2020 as additional data becomes available.
Last Updated: